
HistogramPlus v1.5 na SOS
aktywacja
Zaloguj
lub
Zarejestruj się
aby zobaczyć!
Creating a visual histogram from a set of numerical data is maybe the most comprehensive way for truly understanding its nature.
Every major statistical software, including Excel, offers a histogram view of the data but it is usually a static and certainly not a very appealing one, limiting the depth of the analysis.
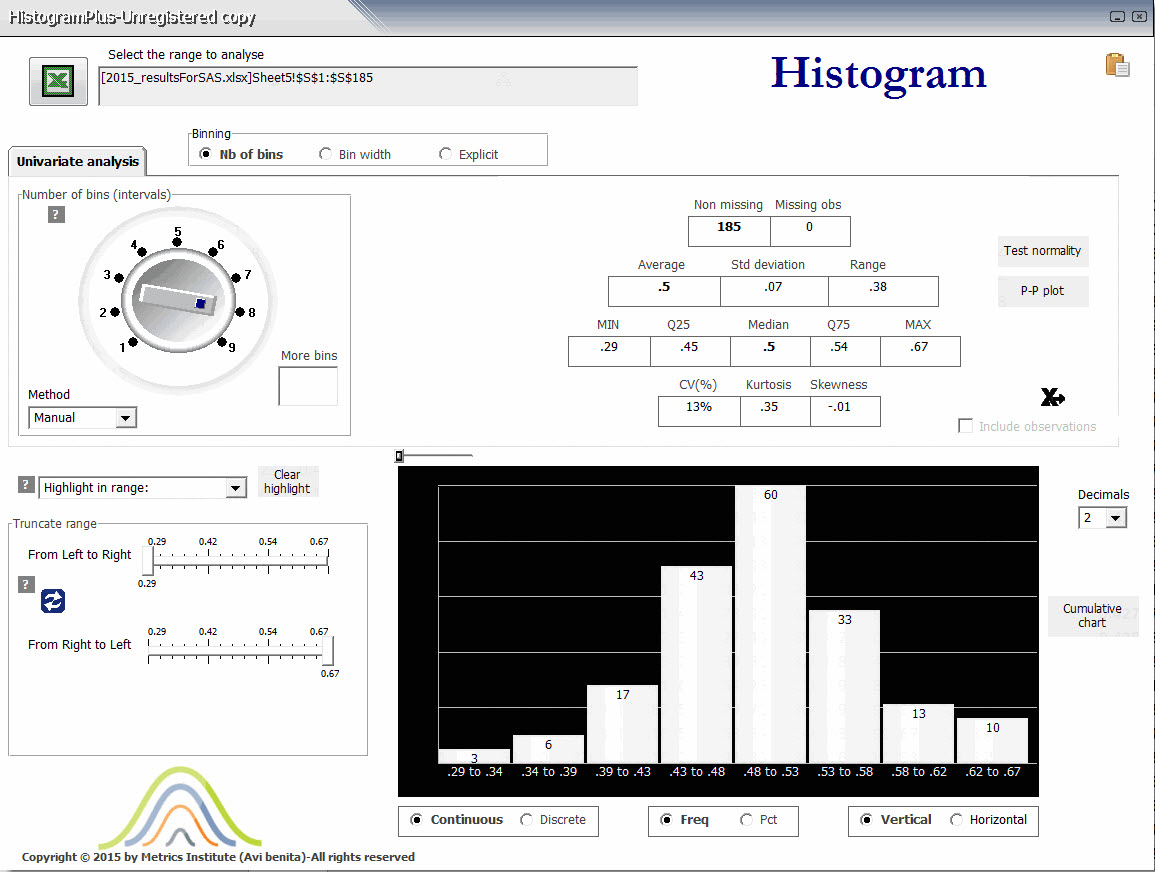
HistogramPlus is aimed at filling the gap by giving to the data analyst the ultimate Swiss knife for creating Excel histograms from data and interactively analyzing them in depth. It features 4 normality tests and P-P plots for 8 distributions.
Just select the range of data and the Excel histogram and related statistics will pop-up ready for further interactive analysis.
What distinguishes HistogramPlus from similar tools is, among other things, it’s totally new and innovative approach for interacting dynamically with the data through sliders and knobs.
HistogramPlus has been designed especially for Excel histograms and not as a side component of some statistical software. It was created with these specifications in mind:
The binning process must be interactive and cover many possible scenarios
Data can be interactively truncated for evaluating outliers’ impact
Discrete values must be dealt accordingly to their special nature and particularly adapted to survey data
Complete statistics of the data should be displayed along with the histogram
It should be based on a universal platform (Excel)
It should be very fast and requiring almost no data entry
It should possess the tools for evaluating the theoretical shape of the distribution
It must be very affordable
Zaloguj
lub
Zarejestruj się
aby zobaczyć!
aktywacja
Zaloguj
lub
Zarejestruj się
aby zobaczyć!