
- Dołączył
- 12 Maj 2011
- Posty
- 1571
- Reakcje/Polubienia
- 648
While you enter data, the app will calculate statistics and draw graphs corresponding to the data entered.
Available graphs:
- Bar chart
- Histogram
- Box Plot
- Line chart
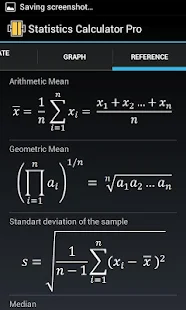
Statistics:
- Sample size
- Arithmetic Mean
- Geometric Mean
- Mode
- Minimum
- Maximum
- Sum
- Median
- Variance
Zaloguj
lub
Zarejestruj się
aby zobaczyć!